
Educational SPY walkthrough
One underlying.
Two chart views.
One decision order.
This example shows how a trader can move from four hour context to fifteen minute detail without treating a zone, candle, or alert as a complete trade decision.
Start the walkthrough ↓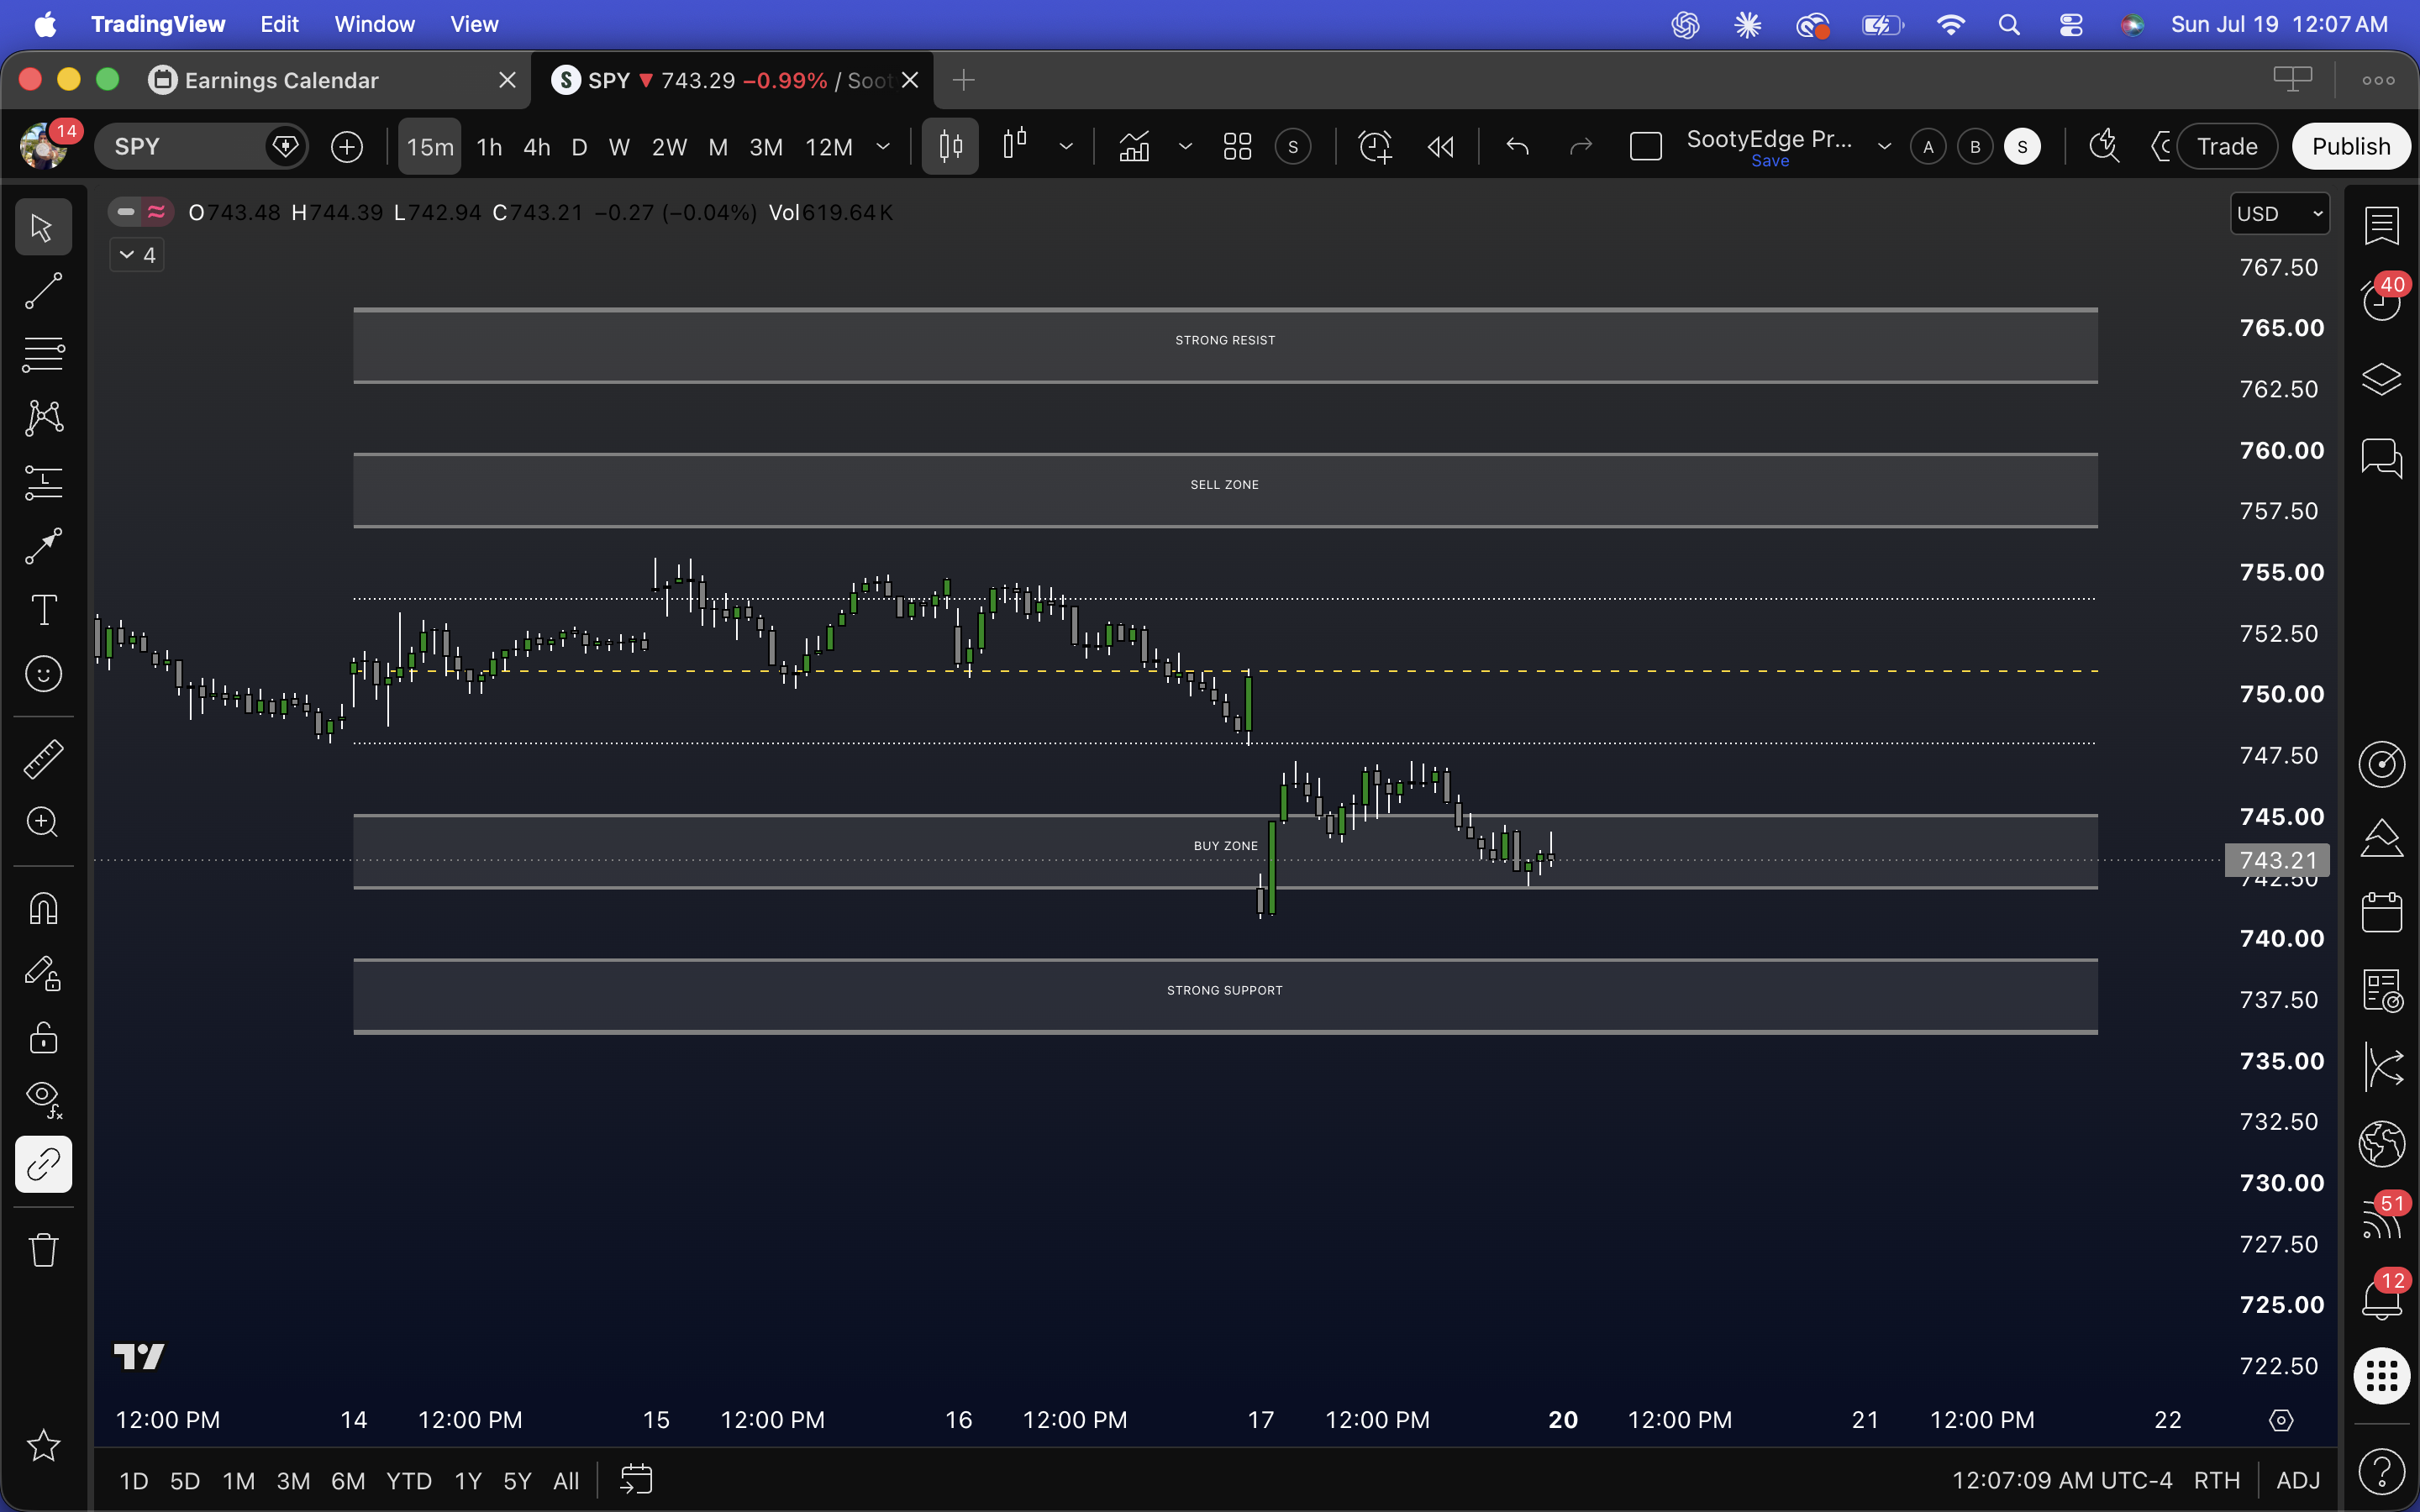
These are captured charts, not live market data. The walkthrough explains process and visible chart structure only. It does not evaluate what happened afterward or recommend buying or selling SPY or any option.
01 / CONTEXT
Start with the wider view
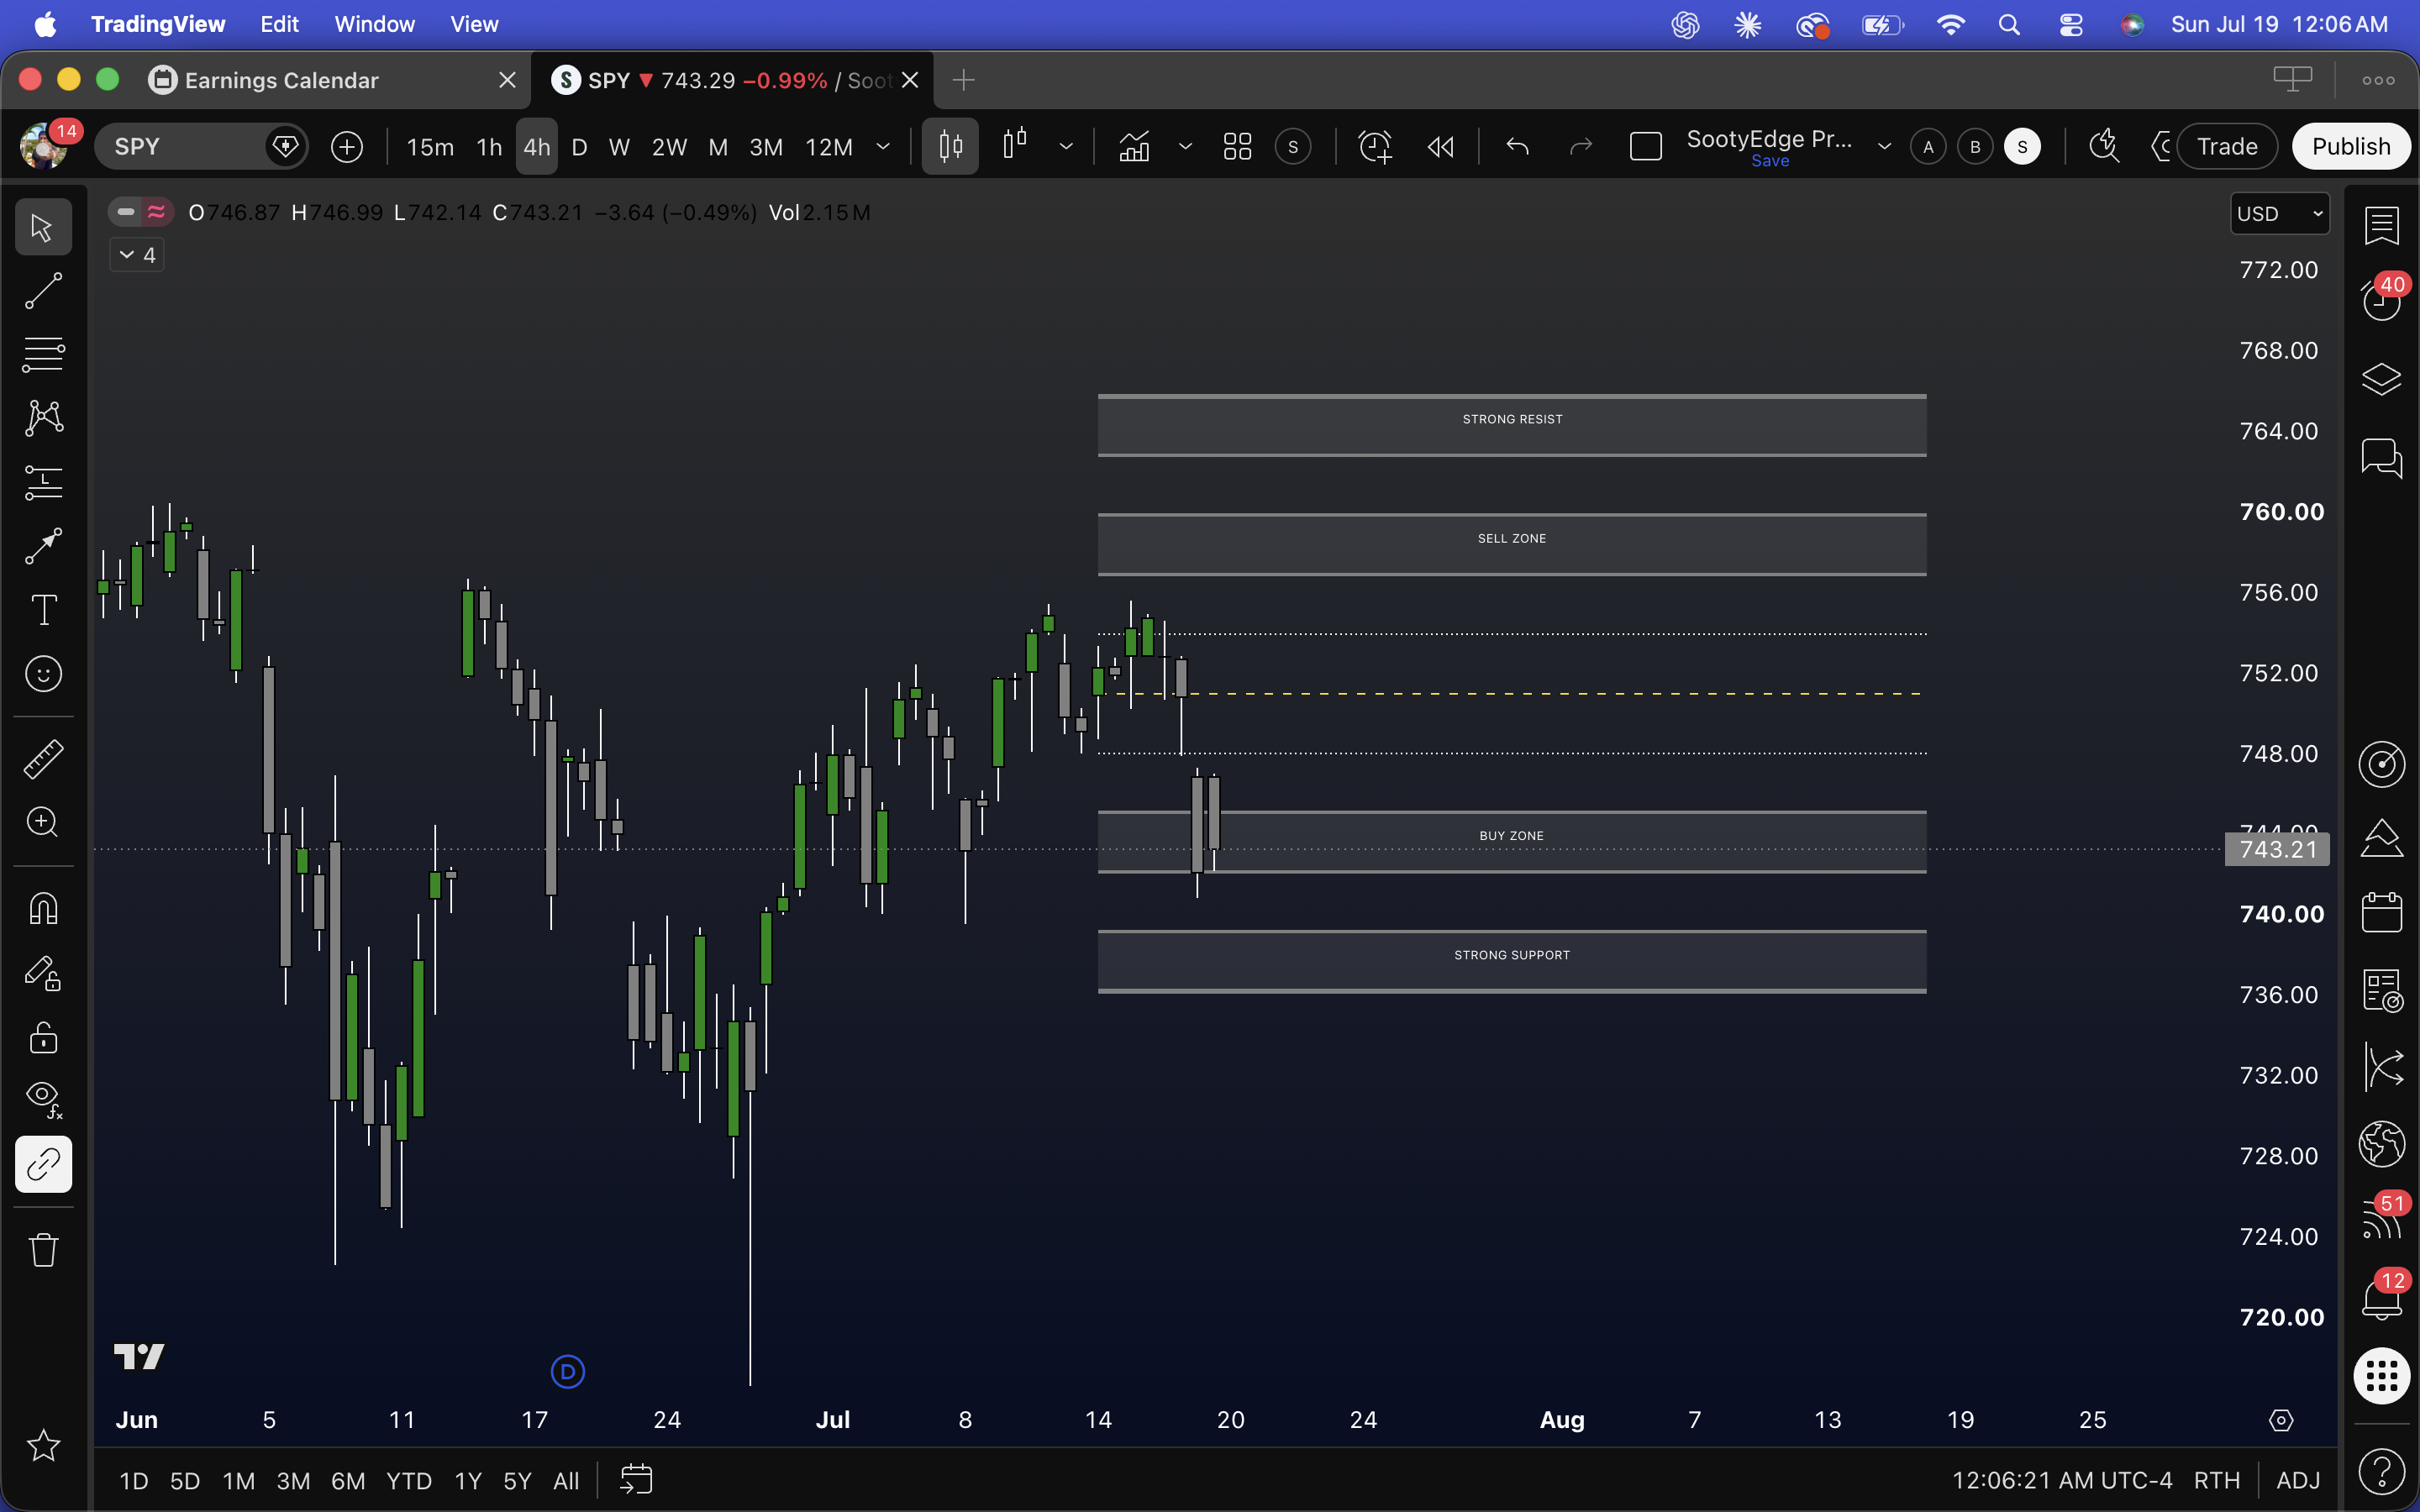
Use the four hour chart to understand location.
In the captured four hour view, SPY is displayed inside the labeled Buy Zone. Strong Support is mapped below, while the Sell Zone and Strong Resist band remain overhead.
- Price location inside a predefined decision band
- Strong Support mapped below the active zone
- Anchor boundaries and a gold retest reference
- Two upside decision bands mapped in advance
- That buyers have confirmed control
- That price must reverse from the zone
- That a long entry is valid
- That any particular option contract is suitable
Operator rule: Location creates a question. It does not answer it.
02 / DETAIL
Move down without changing the map
Use the fifteen minute chart to inspect behavior.
The captured fifteen minute view preserves the same decision bands and reveals more of the path into the Buy Zone. This adds detail, but it does not replace the higher timeframe context.
Operator rule: A lower timeframe adds precision, not permission.
Apply the complete system
The screenshots show one layer, not a complete trade.
Action Zones answers the location question. The remaining three tools still have to do their jobs before execution is considered.
- 01Flow Tracker
What is the trend?
Check the higher timeframe and chart timeframe environment first. If the views conflict, the process stops at wait.
Not shown in these Action Zones screenshots; it must be checked separately. - 02Retest Rally
Who has control?
Look for a break, revisit, and confirmed hold. A zone touch by itself does not establish control.
Not shown here; confirmation cannot be inferred from location alone. - 03Action Zones
Where are the decision areas?
Use the labeled bands to organize location, nearby reaction areas, and the room to the next decision point.
This is the layer displayed in both captured charts. - 04Key Levels
Where is the trade structured?
Define the entry reference, invalidation, objectives, and risk only after the first three questions align.
Not shown here; no entry, stop, or target should be invented from these images.
The disciplined output
End with a plan or a documented reason to wait.
SootyEdge is designed to narrow decisions. It does not force every chart into a trade and it does not turn a labeled zone into a signal.
Continue the product tour
See how all four indicators fit into the complete workflow.
Review the software page for the role, visible outputs, alerts, delivery process, price, and limitations of each tool.